


Resistance per Ton of Displacement
Question:
This is an answer to the 2nd part of a Question on Propeller Thrust, from one seeking to know if there's a method to estimate Speed from Thrust, or, what Resistance does a boat have, given a certain Type and Speed? Pedro-G, BR
.
ESTIMATING BOAT RESISTANCE VALUE
You will note from this earlier article on What Makes Up Boat Resistance that there are 5 main parts. Not one of these can be calculated to a finite accuracy as assumptions are needed for at least a part of each calculation. Even underwater Skin friction which is one of the most predictable parts to calculate, requires assumptions for surface roughness as well as assuming that water speed over the whole surface is constant etc. The residuary Wave Resistance is varying even more, changing with each reorientation of the boat and with each wave it meets or creates.
But overall, model tests under controlled conditions can produce ‘close ballpark figures’ for boats of different types travelling at different speeds, assuming no wind and calm water. As the boats weight is reflected in its displacement and its surface resistance reflected significantly by boat type, curves can be produced for each type, giving an approximate Resistance per L/ton relative to the Speed-Length Ratio (SLR), assuming that the boat was designed for the speed used.
Such curves have been published by the Society of Naval Architects & Marine Engineers (SNAME) dating back to the 1950’s and I have found them a useful guide to give an idea of ‘What Thrust will give What Speed’, when considering a power source, be it motor, sails or even for towing. For sure, there will be exceptions but then, when you are working with the dozens of variables thrown at a boat in operation, expecting to have a 100% prediction of resistance is at best ‘a pipe dream’. The SNAME curves kept things in perspective and give a surprisingly good idea what the total (calm water) hull drag is likely to be, related to its operating displacement. But over the years, some progress has been made both in hull forms and improved knowledge of how best the resistance components should be divided up, so an occasional update of these curves is worth the effort.
So below, I am including a chart, with some original curves from SNAME now in dotted black, but with added updates for 3 types of boats, now including long narrow hulls as used for multis as well as a predicted curve for future hydrofoils that are becoming more efficient with each passing year.
. 
NOTE: As this was first plotted back in the '50’s, the Length is given in Feet, Speed is in Knots, Displacement is in Long tons of 2240lbs, and Resistance is in Lbs. (Metric conversion factors are given at the base of this article). Typical variation of R/Ton is likely to be +10%/-5% with the occasional boat even 20% off its curve. But many will be closer and I think the main thing to get from these curves is an understanding of how their resistance varies with type and L/B ratio.
When discussing the Lines of the W17 for Professional Boatbuilder, I also published some curves that showed how the balance of resistance typically changes with hull slimness (higher L/B ratios), when the Residuary (wave) Resistance dropped, so making the percentage of frictional resistance proportionally higher. In that chart, I just showed the indicated percentage of 3 main contributors to Total Resistance, but gave no specific values. I am including this Plot again here for easy Reference. But the main Resistance per Ton chart does have approximate values and you can see, for example, how the lowered wave making resistance affects the total between a Speed Length ratio of 1 and 4 (see lines Blue and Green in the chart above). 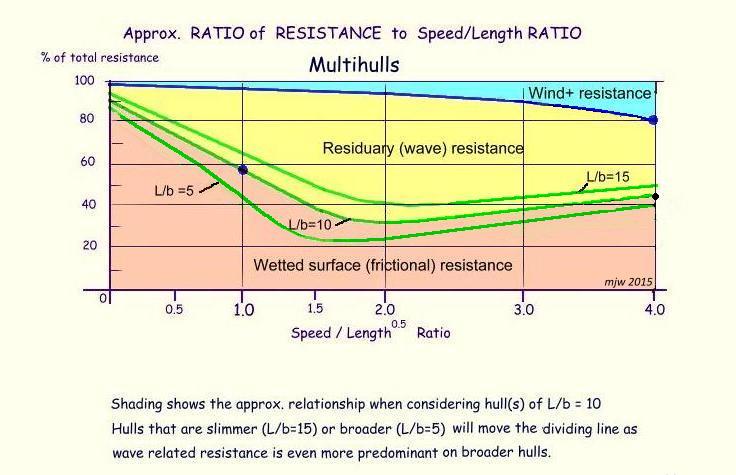
It’s also interesting to observe that long slim hulls can have less resistance than a planing hull up to a certain speed .... but then (in calm water), the planing hull shows an advantage, as its form at high speed creates very little wave disturbance and is then mostly affected by its skin friction. But then, one needs to keep in mind that planing hulls need to be kept flat with minimal heel in order to be fully effective ... clearly a potential issue with most sailboats. So while the curves above show a lower resistance for planing boats when faster than say a Speed/Length Ratio of 4, this would not apply for a sailboat that heels, as the same lift and low drag would not be possible.
The curves also show the high resistance of wide, non-planing rounded hulls at speed, when wave making can become relatively high …. just serving to underline that this is not a good shape for such high Speed-Length-Ratios. However, there are always cases where a boat shape may need to be compromised for other reasons, such as for seakeeping, say for a lifeboat.
[Note of course, that these resistance figures do not include the resistance of appendages nor the inevitable wind resistance]. See this earlier article for comments on these.
USING THE CURVES
Let’s now have some fun with these graph plots and explore how such Resistance per Ton curves might help in estimating other useful values, by working through these 4 examples.
- A 25 ft wide planing motor boat. Operating Displacement 3000 lbs, Speed 30 kts, Prop diam 14”
- A trimaran of 40ft, 39ft WL
- A catamaran of 40ft, 39ft WL
- A single racing scull of 24ft WL and, a Rowing 4 of 43ft WL.
A: So what will approximately be the Thrust on the prop at the top speed of 30 kts. and is cavitation likely ?
First, although the graph data was based on a boat with an L/B ratio of 4, a wider boat will simply lift earlier but the actual drag per ton at speed is unlikely to go much beyond the normal margins already indicated. So for a planing craft travelling at a high SLR of 6, the (red) curve indicates ~370 lbs/L.ton. 3000 lbs = 3000/2240 = 1.34 L/tons. So the Total Hull Resistance in flat water is indicated as 1.34 x 370 = 496 lbs. If we assume a Prop Slip of 10%, the thrust on the blades could be estimated as 1.1 x 496 = 545 lbs. With a 14” prop, the swept disk area = πr^2 or 3.14 x 7^2 = 154 sq.in. If the blades take up 80% of this, then the Disc Area Ratio is 0.80. So the blade area will be 154 x 0.80 = 123 sq.in . So with an anticipated thrust of 545 lbs, the blade pressure will be approx. 545/123 = 4.43 lbs/sqin which, even allowing for a +/-15% error, is well below the 10 psi pressure that might cause cavitation.
B & C: So, from these curves, how might the Resistance of a slim hulled trimaran compare to a Catamaran of the same length ? We will initially need to assume some weights and design speeds. Say 7 tons and 15k for the Cat and 6 tons and 16k for the Tri which could be typical for a fast cruiser of each type.
We might also assume that the center hull of a 40ft trimaran has an L/B of say 10, while each hull of the catamaran might be slimmer with an L/B of say 12. Such variations of slimness, will require some interpolation between curves as specific plots for each L/B ratio are not given, though the trend is certainly indicated in both graphs above. Assume a waterline length of 39ft in both cases.
The CAT will therefore have a design SLR of 15/39^0.5 = 2.40 and 16/39^0.5 = 2.56 for the TRI.
Assuming no heel, the Green line indication for the CAT will be 185lb/ton or 2(7/2 x 185) = 1295 lbs @ 15 kts
The indication for the TRI will be 205lbs/ton or 205 x 6 = 1230 lbs @ 16 kts, indicating that the tri will indeed have lower drag and be faster then the cat with a similar power or sail area. When heeled, the main tri hull will lift as the Ama goes in. As the SLR will rise slightly for the shorter ama, this would raise the Res/Ton, but the slimmer Ama hull will lower the Res/Ton, so one tends to cancel out the other, indicating there is not much change with a moderate heel under say 15 degrees.
D: With 14 kg as an Olympic regulation minimum, a racing scull will typically weigh barely 40 lbs so the main weight will be that of the rower. Lets assume 224 lbs total or 0.1 L/T
With a speed of 10kts, the SLR will be 2.04, giving an indicated Res/Ton of ~150 lbs/t with its extreme L/B of 23/1.15 = 20 and so an indicated total resistance of 15 lbs.
For a 4 person scull, Length would be more like 43' LWL and the weight say 130 lbs. 4 crew could be 720lbs, so a total of 850 lbs or 0.38 L/t. Speed about 10.5kts. So SLR = 10.5/43^0.5 = 1.60. Drag 110 lbs/ton x 0.38 = 42 lbs. L/B ratio of 43/1.43 = 30. Such long slim boats are generally considered to have a resistance breakdown of about 88% friction and 12% wavemaking, placing them more on the Blue line than the Green. One could argue that these extremely slim boats now start to pay a penalty with slightly higher skin friction compared to a boat with an L/B closer to 20.
....................................................................................
So how accurate are this graphs ? If the boat is of the type indicated, figures will mostly be within +10%/-5%, though occasionally go to +15%.
Of course, if there are unusual appendages underwater or a very poorly-faired skin and if the operating conditions are not ‘calm with little wind’, then significant allowances may be required for these anomalies.
Also keep in mind that a very 'poor hull shape for its speed', can more than double these plotted values that all assume the hull design is well matched to the speed specified.
These Resistance Figures can also be used to estimate the Shaft Horsepower (SHP) required using this simple formula:
Estimated SHP = Resistance (lbs) x V / (326 x PC) (Propulsive Coeff)
PC is now the main unknown but will typically vary from 0.4 to 0.75. Resistance also needs to be increased for appendages and weather margin, say up 30%. Looking at Example A above, we might assume a PC of 0.65 and an added Slip of 10% to Speed V.
Then ... SHP = (496 x 1.3) x (30 x 1.1) / (326 x 0.65) = (645 x 33) / 212 = 100 shp
Mike .... posted Jan 2024
METRIC CONVERSIONS
I knot = 0.514 m/sec. (Scull top speeds are about 5.5 m/sec or 10.7k)
I knot = 1.853 kph
I L/T = 2240/2204 M/t = 1.0163 m/t
1 lb = 0.4536 kg (2.2046 lbs/kg)
So, if you are more used to working with the Metric System, your Length in Meters will first need to be multiplied by 3.28 to be in Feet. If you are also working in m/sec instead of KNOTS, then divide your m/s value by 0.514 to find Knots. Having now got the V/L^0.5 figure needed, the upper graph will give you a value for Resistance per TON for the type of hull you are considering. To convert that Lbs/L/T into kg/Metric Ton, multiple the R/T Value by 0.4463 (1/2.2046) x 2204/2240) for Resistance in Kg/Metric tonne.
.
"New articles, comments and references will be added periodically as new questions are answered and other info comes in relative to this subject, so you're invited to revisit and participate." —webmaster
"See the Copyright Information & Legal Disclaimer page for copyright info and use of any part of this text or article"